
Manchester City Council has confirmed some private landlords will need to license their properties. A selective licensing programme came into force this week. It covers the south Manchester areas of Moss Side and Rusholme.
Manchester City Council has confirmed some private landlords will need to license their properties. A selective licensing programme came into force this week. It covers the south Manchester areas of Moss Side and Rusholme.

It's a question all landlords ask themselves. Your initial feelings on the matter probably come down to whether you are a pet lover yourself.

There seems to be no stopping Manchester as ever more businesses move into the city. The latest Savills 'Manchester Office: Market Spotlight' report has revealed that the city has seen a 20% increase year-on-year in the take-up of office space with experts believing that this expansion will result in significant employment growth over the next five years.
Do you travel regularly on the London Tube? Ever get frustrated at the crowds when commuting or shopping? Just not certain which route is best?

We're pleased to announce our donation of 50% of our turnover from week commencing 5th June, to support the victims of the Manchester Arena bombings.

No one wants to pay tax but, unless you're an internet giant, it's a sad fact of life. For buy-to-let landlords, this tax year has been a strain.

Along with five other areas in the UK, Greater Manchester has been chosen to receive full-fibre broadband.

April 1st, 2018 should be a date circled on every landlord’s calendar. This is when the new minimum energy efficiency standards come into force.

It's the street musicians equivalent of the X Factor. Auditions are being held for 100 coveted busking pitches on the London Underground.

Later this year smart motorways will arrive in Greater Manchester. After plans were first unveiled in 2010 the 17-mile stretch on the M62 and M60 will finally open in September 2017.
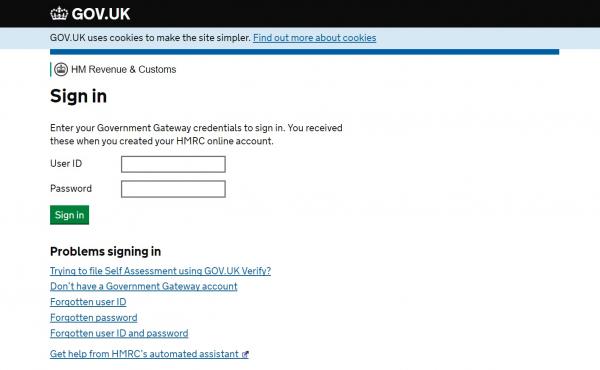
As a landlord you probably don’t think of yourself as a business owner, however being a landlord, you’re almost certainly self-employed or perhaps even a small business owner. What is for certain, HMRC does consider landlords receiving money from renting a property out to be in business. And landlords must complete a Self Assessment.

As a landlord dealing with tenants is of course one of the most important aspects of your business. It is also one of the most time-consuming and, at times, inconvenient too.

