
We're a nation of pet lovers. But, sadly, landlords don’t always share our love for our furry four-legged friends. Hopefully, we'll be able to give you a few pointers to help you out.

hey are fairly common as they allow both landlord and tenant some flexibility on terminating a lease. But what exactly is a break clause and how does having one affect landlords and tenants?

As well as high demand, there is also a lot of competition among landlords. To rise above the crowd, you need your property to stand out and offer tenants what they want. But what is it that they actually want?

Moving home is a very exciting but incredibly stressful event, and if you've got children, those stress levels will go through the roof especially on moving day. Read our tips on how to tackle this family adventure.

The little extras which can tip the scales in favour of one property over another. Here are a few other things to bear in mind when choosing your new home.

Modern properties are getting smaller. Most of us will need to make the most of smaller rooms in our homes. Sometimes inspiration isn't easy to come by so here are our top ten ideas for both tenants and landlords on making the most of any small space.

Why renewing a tenancy is a good idea and what you need to know if your tenants want to renew the contract.
The Government has published a consultation on its plans to abolish Section 21, open from 21 July to 12 October 2019.

Is buying off-plan a good idea or not?
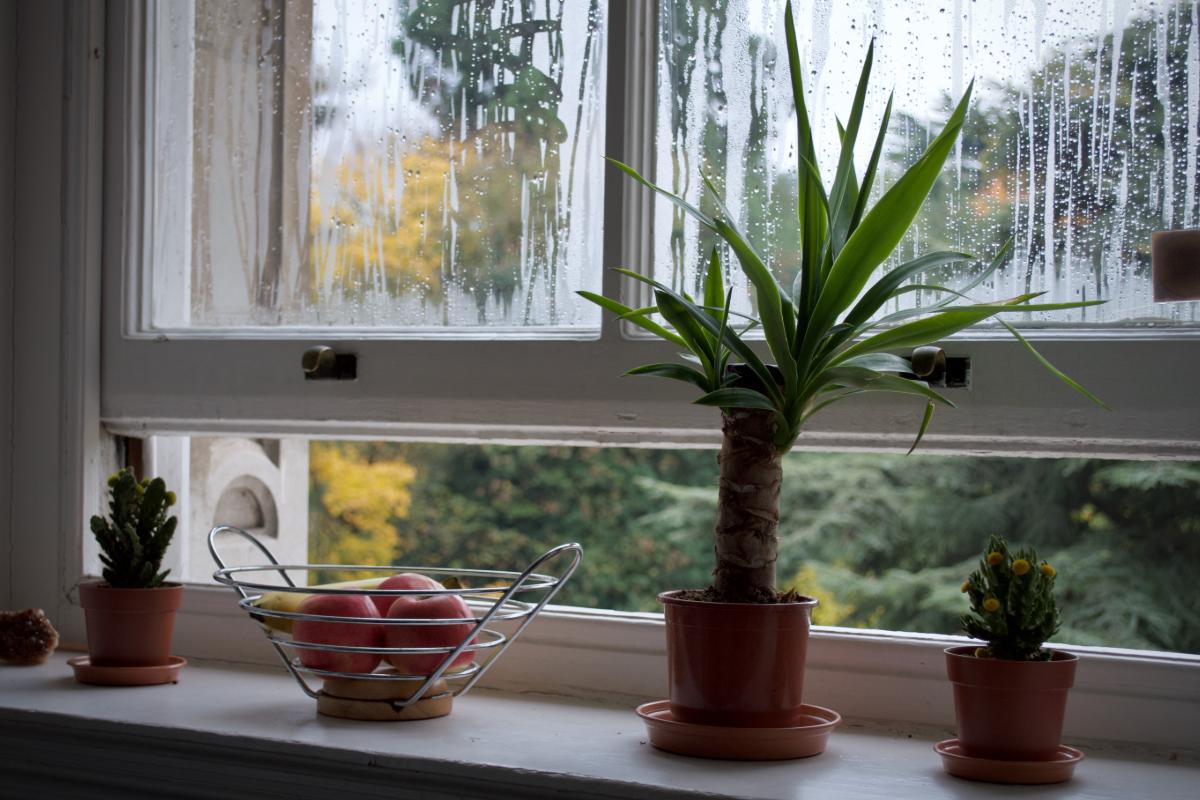
We have looked at different causes of damp and mould, what landlords and tenants should do to resolve a damp problem and what the regulations cover.
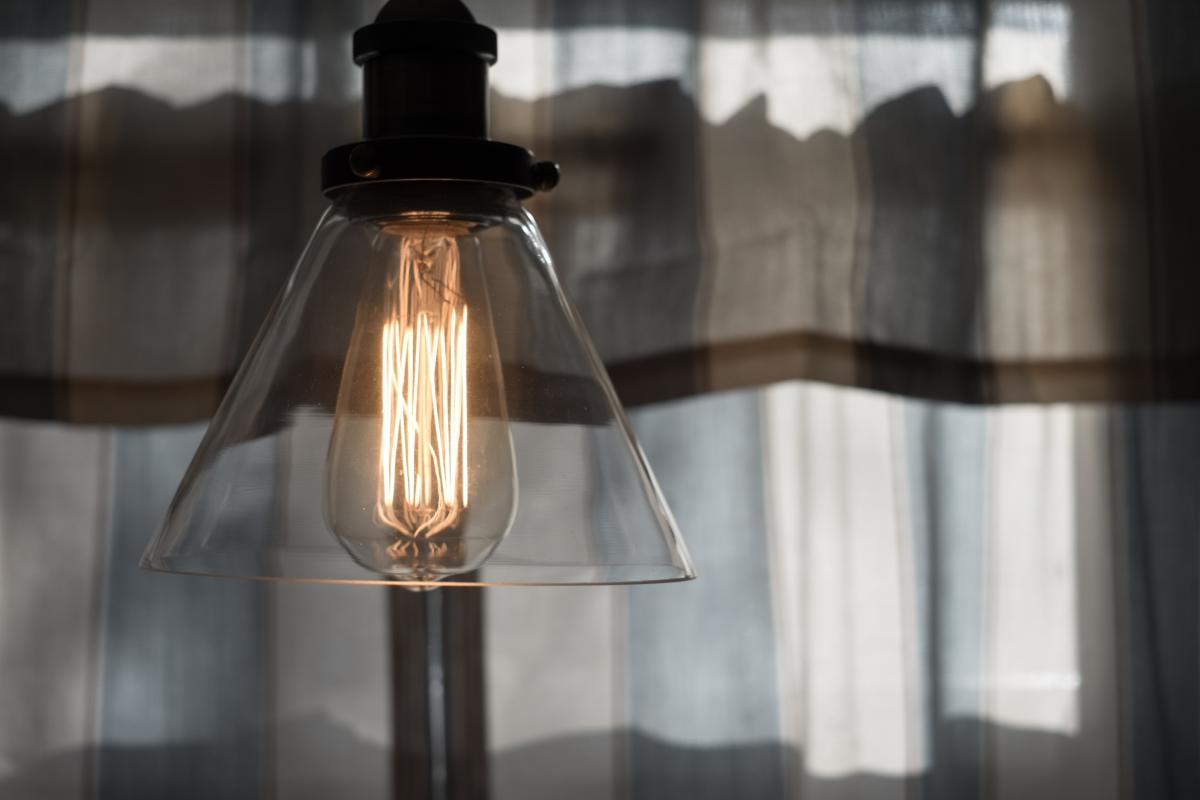
There are small things we can all do which collectively can have a positive impact on our environment. But what practical steps can you take as a tenant to make yourself live greener and your rental property to be more efficient?

The transition from a fixed term shorthold tenancy to a rolling contract, or periodic tenancy, is a process which can be confusing to both tenants and landlords.

